January temperature outlook
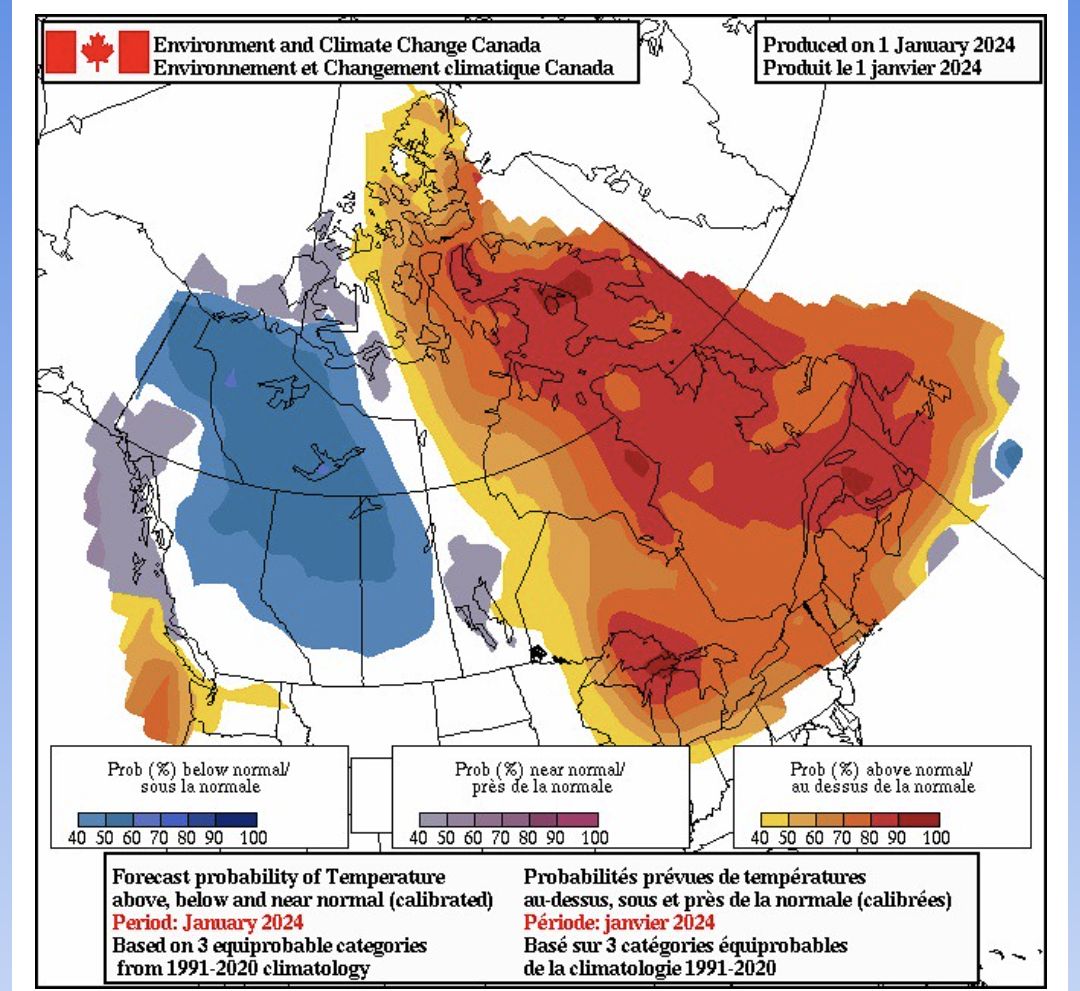
Let's have a look at the map for the month of January, to see whether temperatures in your region will be below or above average. The forecasts are categorized as follows:
- blue indicates the probability that temperatures will be below normal;
- grey to purple indicates the probability that temperatures will be near normal;
- yellow to red indicates the probability that temperatures will be above normal; and
- white indicates uncertainty regarding the temperature tendency this month.
 All categories are compared to the 30 months of January between the 1991-2020 period. This map is a prediction of the daily average temperature anomaly (difference from normal) at 2 metres, the standard forecast height. It is not a daily maximum or minimum temperature forecast.
Long-range forecast user guide.
.
All categories are compared to the 30 months of January between the 1991-2020 period. This map is a prediction of the daily average temperature anomaly (difference from normal) at 2 metres, the standard forecast height. It is not a daily maximum or minimum temperature forecast.
Long-range forecast user guide.
.